


West Salmon Falls CCD, Twin Falls County, Idaho
About
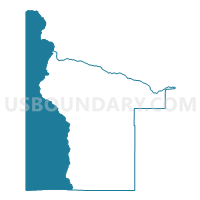
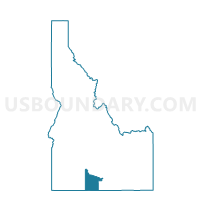
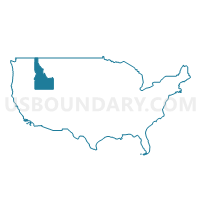
Outline

Summary
| Unique Area Identifier | 125949 |
| Name | West Salmon Falls CCD |
| County | Twin Falls County |
| State | Idaho |
| Area (square miles) | 661.78 |
| Land Area (square miles) | 659.75 |
| Water Area (square miles) | 2.03 |
| % of Land Area | 99.69 |
| % of Water Area | 0.31 |
| Latitude of the Internal Point | 42.36400230 |
| Longtitude of the Internal Point | -114.91536920 |
| Total Population | 361 |
| Total Housing Units | 234 |
| Total Households | 144 |
| Median Age | 40.2 |
Maps
Graphs
Select a template below for downloading or customizing gragh for West Salmon Falls CCD, Twin Falls County, Idaho


Neighbors
Neighoring County Subdivision (by Name) Neighboring County Subdivision on the Map
- Bliss CCD, Gooding County, ID
- Bruneau CCD, Owyhee County, ID
- Buhl CCD, Twin Falls County, ID
- Glenns Ferry CCD, Elmore County, ID
- Hagerman CCD, Gooding County, ID
- Hollister CCD, Twin Falls County, ID
- Jackpot CCD, Elko County, NV
- Jarbidge CCD, Elko County, NV
- Wendell CCD, Gooding County, ID
Top 10 Neighboring Unified School District (by Population) Neighboring Unified School District on the Map
- Elko County School District, NV (48,818)
- Buhl Joint School District 412, ID (8,666)
- Filer School District 413, ID (6,845)
- Wendell School District 232, ID (5,436)
- Glenns Ferry Joint School District 192, ID (2,666)
- Bruneau-Grand View Joint School District 365, ID (2,533)
- Hagerman Joint School District 233, ID (2,433)
- Castleford School District 417, ID (1,408)
- Bliss Joint School District 234, ID (749)
- Three Creek Joint Elementary School District 416, ID (73)
Top 10 Neighboring State Legislative District Lower Chamber (by Population) Neighboring State Legislative District Lower Chamber on the Map
- Assembly District 33, NV (51,407)
- State House District 23, ID (45,710)
- State House District 25, ID (43,165)
- State House District 22, ID (34,066)
Top 10 Neighboring State Legislative District Upper Chamber (by Population) Neighboring State Legislative District Upper Chamber on the Map
- Rural Nevada Senatorial District, NV (97,335)
- State Senate District 23, ID (45,710)
- State Senate District 25, ID (43,165)
- State Senate District 22, ID (34,066)
Top 10 Neighboring 111th Congressional District (by Population) Neighboring 111th Congressional District on the Map
- Congressional District 1, ID (841,930)
- Congressional District 2, NV (836,562)
- Congressional District 2, ID (725,652)
Top 10 Neighboring Census Tract (by Population) Neighboring Census Tract on the Map
- Census Tract 9602, Gooding County, ID (7,990)
- Census Tract 9601, Gooding County, ID (7,474)
- Census Tract 3, Twin Falls County, ID (5,332)
- Census Tract 9502, Owyhee County, ID (3,913)
- Census Tract 9601, Elmore County, ID (2,797)
- Census Tract 15, Twin Falls County, ID (2,670)
- Census Tract 9517, Elko County, NV (2,669)
Top 10 Neighboring 5-Digit ZIP Code Tabulation Area (by Population) Neighboring 5-Digit ZIP Code Tabulation Area on the Map
- 83316, ID (9,626)
- 83355, ID (5,405)
- 83332, ID (2,361)
- 83314, ID (898)
- 83321, ID (550)
- 83633, ID (540)
- 83302, ID (196)
Data
Demographic, Population, Households, and Housing Units
** Data sources from census 2010 **
Show Data on Map
Download Full List as CSV
Download Quick Sheet as CSV
| Subject | This Area | Twin Falls County | Idaho | National |
|---|---|---|---|---|
| POPULATION | ||||
| Total Population Map | 361 | 77,230 | 1,567,582 | 308,745,538 |
| POPULATION, HISPANIC OR LATINO ORIGIN | ||||
| Not Hispanic or Latino Map | 304 | 66,660 | 1,391,681 | 258,267,944 |
| Hispanic or Latino Map | 57 | 10,570 | 175,901 | 50,477,594 |
| POPULATION, RACE | ||||
| White alone Map | 311 | 68,693 | 1,396,487 | 223,553,265 |
| Black or African American alone Map | 1 | 342 | 9,810 | 38,929,319 |
| American Indian and Alaska Native alone Map | 3 | 606 | 21,441 | 2,932,248 |
| Asian alone Map | 0 | 922 | 19,069 | 14,674,252 |
| Native Hawaiian and Other Pacific Islander alone Map | 0 | 83 | 2,317 | 540,013 |
| Some Other Race alone Map | 40 | 4,829 | 79,523 | 19,107,368 |
| Two or More Races Map | 6 | 1,755 | 38,935 | 9,009,073 |
| POPULATION, SEX | ||||
| Male Map | 185 | 38,115 | 785,324 | 151,781,326 |
| Female Map | 176 | 39,115 | 782,258 | 156,964,212 |
| POPULATION, AGE (18 YEARS) | ||||
| 18 years and over Map | 270 | 56,086 | 1,138,510 | 234,564,071 |
| Under 18 years | 91 | 21,144 | 429,072 | 74,181,467 |
| POPULATION, AGE | ||||
| Under 5 years | 25 | 6,367 | 121,772 | 20,201,362 |
| 5 to 9 years | 30 | 5,919 | 121,195 | 20,348,657 |
| 10 to 14 years | 26 | 5,543 | 116,955 | 20,677,194 |
| 15 to 17 years | 10 | 3,315 | 69,150 | 12,954,254 |
| 18 and 19 years | 10 | 2,301 | 46,209 | 9,086,089 |
| 20 years | 1 | 1,176 | 22,204 | 4,519,129 |
| 21 years | 1 | 998 | 21,776 | 4,354,294 |
| 22 to 24 years | 5 | 3,105 | 64,229 | 12,712,576 |
| 25 to 29 years | 20 | 5,439 | 106,734 | 21,101,849 |
| 30 to 34 years | 18 | 5,011 | 102,231 | 19,962,099 |
| 35 to 39 years | 33 | 4,597 | 96,845 | 20,179,642 |
| 40 to 44 years | 24 | 4,162 | 94,764 | 20,890,964 |
| 45 to 49 years | 13 | 4,941 | 103,560 | 22,708,591 |
| 50 to 54 years | 40 | 5,061 | 104,977 | 22,298,125 |
| 55 to 59 years | 34 | 4,570 | 96,997 | 19,664,805 |
| 60 and 61 years | 16 | 1,657 | 35,125 | 7,113,727 |
| 62 to 64 years | 9 | 2,362 | 48,191 | 9,704,197 |
| 65 and 66 years | 8 | 1,290 | 27,113 | 5,319,902 |
| 67 to 69 years | 9 | 1,806 | 36,315 | 7,115,361 |
| 70 to 74 years | 11 | 2,557 | 46,106 | 9,278,166 |
| 75 to 79 years | 10 | 1,998 | 34,278 | 7,317,795 |
| 80 to 84 years | 6 | 1,467 | 25,614 | 5,743,327 |
| 85 years and over | 2 | 1,588 | 25,242 | 5,493,433 |
| MEDIAN AGE BY SEX | ||||
| Both sexes Map | 40.20 | 34.40 | 34.60 | 37.20 |
| Male Map | 40.40 | 33.60 | 33.70 | 35.80 |
| Female Map | 39.50 | 35.30 | 35.40 | 38.50 |
| HOUSEHOLDS | ||||
| Total Households Map | 144 | 28,760 | 579,408 | 116,716,292 |
| HOUSEHOLDS, HOUSEHOLD TYPE | ||||
| Family households: Map | 94 | 19,954 | 403,144 | 77,538,296 |
| Husband-wife family Map | 82 | 15,563 | 320,390 | 56,510,377 |
| Other family: Map | 12 | 4,391 | 82,754 | 21,027,919 |
| Male householder, no wife present Map | 4 | 1,382 | 27,085 | 5,777,570 |
| Female householder, no husband present Map | 8 | 3,009 | 55,669 | 15,250,349 |
| Nonfamily households: Map | 50 | 8,806 | 176,264 | 39,177,996 |
| Householder living alone Map | 35 | 7,002 | 137,785 | 31,204,909 |
| Householder not living alone Map | 15 | 1,804 | 38,479 | 7,973,087 |
| HOUSEHOLDS, HISPANIC OR LATINO ORIGIN OF HOUSEHOLDER | ||||
| Not Hispanic or Latino householder: Map | 129 | 26,100 | 535,994 | 103,254,926 |
| Hispanic or Latino householder: Map | 15 | 2,660 | 43,414 | 13,461,366 |
| HOUSEHOLDS, RACE OF HOUSEHOLDER | ||||
| Householder who is White alone | 130 | 26,517 | 533,392 | 89,754,352 |
| Householder who is Black or African American alone | 0 | 89 | 2,797 | 14,129,983 |
| Householder who is American Indian and Alaska Native alone | 1 | 217 | 6,918 | 939,707 |
| Householder who is Asian alone | 0 | 254 | 5,989 | 4,632,164 |
| Householder who is Native Hawaiian and Other Pacific Islander alone | 0 | 24 | 667 | 143,932 |
| Householder who is Some Other Race alone | 11 | 1,252 | 20,422 | 4,916,427 |
| Householder who is Two or More Races | 2 | 407 | 9,223 | 2,199,727 |
| HOUSEHOLDS, HOUSEHOLD TYPE BY HOUSEHOLD SIZE | ||||
| Family households: Map | 94 | 19,954 | 403,144 | 77,538,296 |
| 2-person household Map | 52 | 8,632 | 174,880 | 31,882,616 |
| 3-person household Map | 11 | 4,081 | 82,320 | 17,765,829 |
| 4-person household Map | 10 | 3,601 | 73,241 | 15,214,075 |
| 5-person household Map | 14 | 2,036 | 40,522 | 7,411,997 |
| 6-person household Map | 5 | 997 | 19,662 | 3,026,278 |
| 7-or-more-person household Map | 2 | 607 | 12,519 | 2,237,501 |
| Nonfamily households: Map | 50 | 8,806 | 176,264 | 39,177,996 |
| 1-person household Map | 35 | 7,002 | 137,785 | 31,204,909 |
| 2-person household Map | 11 | 1,386 | 29,251 | 6,360,012 |
| 3-person household Map | 3 | 246 | 5,222 | 992,156 |
| 4-person household Map | 1 | 80 | 2,086 | 411,171 |
| 5-person household Map | 0 | 31 | 801 | 126,634 |
| 6-person household Map | 0 | 51 | 960 | 48,421 |
| 7-or-more-person household Map | 0 | 10 | 159 | 34,693 |
| HOUSING UNITS | ||||
| Total Housing Units Map | 234 | 31,072 | 667,796 | 131,704,730 |
| HOUSING UNITS, OCCUPANCY STATUS | ||||
| Occupied Map | 144 | 28,760 | 579,408 | 116,716,292 |
| Vacant Map | 90 | 2,312 | 88,388 | 14,988,438 |
| HOUSING UNITS, OCCUPIED, TENURE | ||||
| Owned with a mortgage or a loan Map | 30 | 13,220 | 286,971 | 52,979,430 |
| Owned free and clear Map | 57 | 5,903 | 117,932 | 23,006,644 |
| Renter occupied Map | 57 | 9,637 | 174,505 | 40,730,218 |
| HOUSING UNITS, VACANT, VACANCY STATUS | ||||
| For rent Map | 9 | 798 | 16,360 | 4,137,567 |
| Rented, not occupied Map | 4 | 49 | 997 | 206,825 |
| For sale only Map | 5 | 515 | 12,814 | 1,896,796 |
| Sold, not occupied Map | 1 | 80 | 2,177 | 421,032 |
| For seasonal, recreational, or occasional use Map | 31 | 269 | 41,660 | 4,649,298 |
| For migrant workers Map | 9 | 42 | 632 | 24,161 |
| Other vacant Map | 31 | 559 | 13,748 | 3,652,759 |
| HOUSING UNITS, OCCUPIED, AVERAGE HOUSEHOLD SIZE BY TENURE | ||||
| Total: Map | 2.51 | 2.65 | 2.66 | 2.58 |
| Owner occupied Map | 2.43 | 2.65 | 2.70 | 2.65 |
| Renter occupied Map | 2.63 | 2.64 | 2.56 | 2.44 |
| HOUSING UNITS, OCCUPIED, TENURE BY RACE OF HOUSEHOLDER | ||||
| Owner occupied: Map | 87 | 19,123 | 404,903 | 75,986,074 |
| Householder who is White alone Map | 84 | 18,117 | 380,646 | 63,446,275 |
| Householder who is Black or African American alone Map | 0 | 20 | 1,027 | 6,261,464 |
| Householder who is American Indian and Alaska Native alone Map | 1 | 112 | 3,961 | 509,588 |
| Householder who is Asian alone Map | 0 | 115 | 3,586 | 2,688,861 |
| Householder who is Native Hawaiian and Other Pacific Islander alone Map | 0 | 8 | 316 | 61,911 |
| Householder who is Some Other Race alone Map | 0 | 570 | 10,510 | 1,975,817 |
| Householder who is Two or More Races Map | 2 | 181 | 4,857 | 1,042,158 |
| Renter occupied: Map | 57 | 9,637 | 174,505 | 40,730,218 |
| Householder who is White alone Map | 46 | 8,400 | 152,746 | 26,308,077 |
| Householder who is Black or African American alone Map | 0 | 69 | 1,770 | 7,868,519 |
| Householder who is American Indian and Alaska Native alone Map | 0 | 105 | 2,957 | 430,119 |
| Householder who is Asian alone Map | 0 | 139 | 2,403 | 1,943,303 |
| Householder who is Native Hawaiian and Other Pacific Islander alone Map | 0 | 16 | 351 | 82,021 |
| Householder who is Some Other Race alone Map | 11 | 682 | 9,912 | 2,940,610 |
| Householder who is Two or More Races Map | 0 | 226 | 4,366 | 1,157,569 |
| HOUSING UNITS, OCCUPIED, TENURE BY HISPANIC OR LATINO ORIGIN OF HOUSEHOLDER | ||||
| Owner occupied: Map | 87 | 19,123 | 404,903 | 75,986,074 |
| Not Hispanic or Latino householder Map | 87 | 17,854 | 381,867 | 69,617,625 |
| Hispanic or Latino householder Map | 0 | 1,269 | 23,036 | 6,368,449 |
| Renter occupied: Map | 57 | 9,637 | 174,505 | 40,730,218 |
| Not Hispanic or Latino householder Map | 42 | 8,246 | 154,127 | 33,637,301 |
| Hispanic or Latino householder Map | 15 | 1,391 | 20,378 | 7,092,917 |
| HOUSING UNITS, OCCUPIED, TENURE BY HOUSEHOLD SIZE | ||||
| Owner occupied: Map | 87 | 19,123 | 404,903 | 75,986,074 |
| 1-person household Map | 21 | 3,994 | 81,134 | 16,453,569 |
| 2-person household Map | 44 | 7,576 | 157,743 | 27,618,605 |
| 3-person household Map | 4 | 2,746 | 59,602 | 12,517,563 |
| 4-person household Map | 7 | 2,445 | 54,046 | 10,998,793 |
| 5-person household Map | 6 | 1,304 | 29,170 | 5,057,765 |
| 6-person household Map | 3 | 666 | 14,207 | 1,965,796 |
| 7-or-more-person household Map | 2 | 392 | 9,001 | 1,373,983 |
| Renter occupied: Map | 57 | 9,637 | 174,505 | 40,730,218 |
| 1-person household Map | 14 | 3,008 | 56,651 | 14,751,340 |
| 2-person household Map | 19 | 2,442 | 46,388 | 10,624,023 |
| 3-person household Map | 10 | 1,581 | 27,940 | 6,240,422 |
| 4-person household Map | 4 | 1,236 | 21,281 | 4,626,453 |
| 5-person household Map | 8 | 763 | 12,153 | 2,480,866 |
| 6-person household Map | 2 | 382 | 6,415 | 1,108,903 |
| 7-or-more-person household Map | 0 | 225 | 3,677 | 898,211 |
Loading...